Solutions
Specialized Solutions
The specialized solutions developed by Eurorisk Systems' use all existing features of the basic Risk Framework (RFW) structure and functionality, including system modules, models and the runtime core itself that interprets the models. System model sessions configure the work environment and are used to define basic objects, such as users, business hierarchy, settings, nomenclatures, catalogues, etc. In addition, one or more models define the GUI and the specific business logic of the solution. These models are loaded into the RFW environment to show the actual GUI, ensure interactions with users and perform calculations. These solutions use the RFW database to access common data, such as user data, nomenclatures, market data, etc. Specific data, that has not been saved in the RFW database, can be entered using the GUI, while a model session is created. Session data is saved and available for future work or reporting. A common approach is to start the specialized solution according to its specific nature and define financial objects that describe the financial part of the solution. In this way, the total power of existing modules and functionalities of the platform is used. We currently offer the following spesialised solutions:
- Compliance Check;
- Investment Consulting;
- Real Estate and Fund Management;
- Time Series Analysis;
- Liquidity Management.
Compliance Check
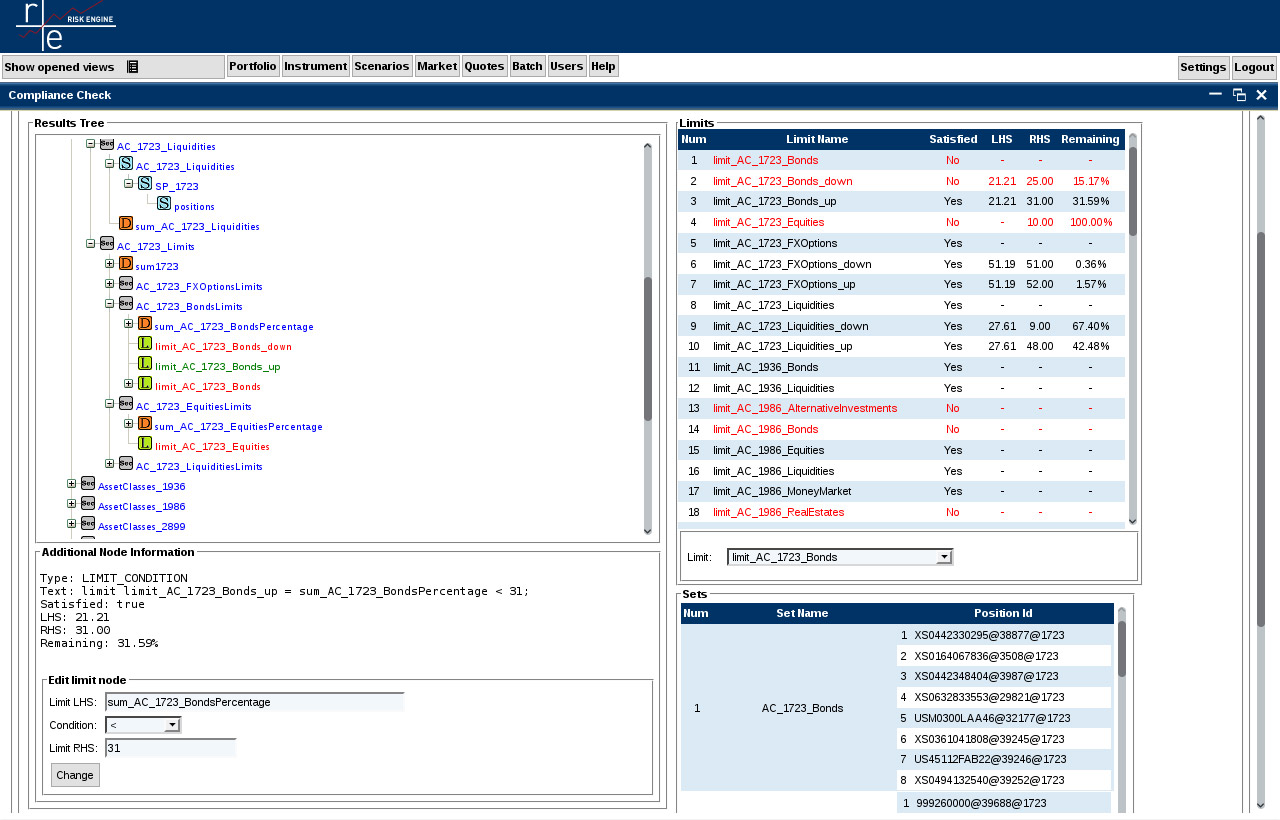
This solution defines and evaluates restriction rules within the RFW platform, such as limits and simple or structured conditions, that apply to selected portfolio sub-sets. The goal is to identify violations, produce warnings and include them into reports. Depending on the portfolio, objects rule sets represent:
- Laws, regulatory rule sets, e.g. FINMA, SBV, Investment Fund Act, etc.;
- General or specific rule sets.
In the first case (regulatory rule sets), the assignment of compliance rule sets can automatically be performed on all portfolios. General rule sets can be assigned to portfolio groups, while individual rule sets can be defined and applied on portfolio or sub-portfolio level.
The first step is to define the compliance structure of a portfolio, based on a tree hierarchy. Each tree node represents a portfolio subset (primary sub-portfolio), which is defined using lists and filters. Primary sub-portfolios are not necessarily exclusive. More complex sub-portfolios (sets) can be built from primary sub-portfolios, using set operations (e.g. union, intersection, difference). Such sub-portfolio sets also belong to the compliance structure.
Rules are defined using GUI controls and can be edited and validated via the formula editor, based on simple expression language. A rule can consist of data elements, arithmetic formulas, aggregation functions, comparison operators, and logical expressions. Aggregation functions (i.e. sum, max, min, average) are applied on sub-portfolios levels and thus define more complex constraints.
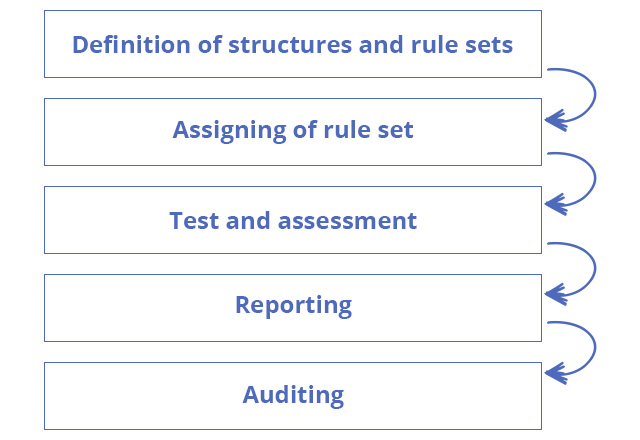
Within a primary structure, rules can be assigned to tree nodes, sets of portfolios or single positions. Compliance can be evaluated at any time - all constraints within a condition (rule) are checked in real time and warning and violation alerts are indicated. The distance to the restriction is coloured, like a traffic light, in green, yellow and red, and is displayed in percentages.
Regulatory and non-standard reports can be displayed on the screen or sent to supervision authorities.
For more information, see Compliance Checks Workflow Concept.
Investment Consulting
Investment Consulting represents a separate solution within the RFW platform, that supports bank activities in attracting investors. The solution offers the prospect of creating investment proposals to clients who consider investing cash amounts, or their own existing assets, in a bank or an external depot. Bank officers can use this solution to:
- Define the investment scopes and fix the existing money potential.
- Estimate the investor's risk class, experience and risk assumption readiness.
- Create a formal proposal of assets or product types, according to the investor’s risk class.
- Create a real investment portfolio by mapping known assets to formal proposals.
- Optimize the portfolio, using the Markowitz risk/return approach.
- Perform compliance checks on real investment portfolios to check for any restrictions.
The risk class assessment of an investor is based on his answers to a series of questions. Each question is assigned to specific question group and each question group has a specific weight within the risk class calculation. The calculated risk class is mapped to a range ‘Low Limit-High Limit’, defined in the nomenclature of risk classes. Depending on which risk class the investor’s risk class is closer to, additional adjustments are conducted: ‘Low Limit’ or ‘High Limit’.
The abstract portfolio consists of bank product groups with appropriate risks and returns. All real and potential investments are evaluated for the entire investment period, provided that the return is invested as well. The investment's worst- and best-case scenario projections are determined. Minimum, maximum, and risk-free contributions are calculated on a period basis.
Real instruments from a bank's instrument pool are mapped to product groups, so that the real investment portfolio is created. In this way, it is possible to observe the credit risk profile for a future investment period. A portfolio optimization is performed to achieve a maximum return at minimum risk. The proposal is tailored to the investor's individual requirements and can be updated each the time market conditions or the investor's financial state changes, by creating a new investment consulting session.
The Investment Consulting Solution can work together with the Compliance Check Solution, to verify the validity against defined rule sets and alert the valuation of certain limits.
The investment proposals can be saved into the database, displayed on the screen or printed out in different report formats, such as via Crystal Reporter, QlikView, Excel, XML, etc.
Real Estate and Fund Management
This solution is developed to assess and manage investments in real estates. The RFW structure, which consists of modules and models, is used to create a working environment. Additional models are created to describe the real estate as a property object or a fund object. Positions and portfolios of property objects, that are defined in RFW, represent the basis of the investment analysis.
The work with property objects in RFW includes the following steps:
- Registration of the property in the Catalog of Properties.
- Definition of data and attributes of the registered property.
- Definition of positions and portfolios describing the financial side of the property.
- Performing the analyses via calculation and simulation approaches.
The Model Property Data and Fund Data in RFW identify properties and define their common features. The financial contracts of a property are represented as positions. Positions (property contracts) come into a real estate portfolio of one or several properties. Portfolio structuring enables the performing of portfolio evaluation, cash flow analysis and interest income analysis, which represent the essence of real estate investment management.
Time Series Analysis
Time Series Analysis represents a universal solution for the analysis of historical time series, such as prices, foreign exchange rates, indexes, interest rates, inter-banking rates, volatilities, etc. The solution is implemented as a Java module and can be invoked and used in both RFW and RE, as well as in other software systems, to perform the following main tasks:
- Clustering of time series.
- Calculation of non-normal distributions.
- Multifactor modelling.
- Assessment of implied ratings.
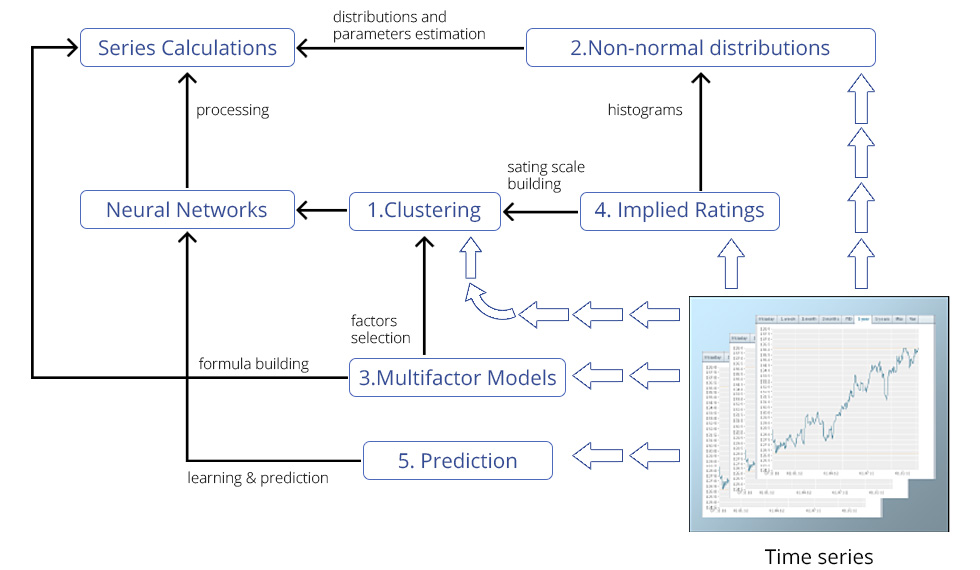
Calculations in time series analysis are based on neuronal network approaches, such as Self-Organising Map (SOM) and a prediction machine.
Clustering of Time Series
Clustering is the grouping of time series, such as bonds, shares, funds and other time developments, into clusters. In this way, series with similar historical behaviour are grouped into the same cluster. Each cluster is then represented by its own synthetic time series (prototype), enabling the work with one series, instead of all the real cluster series.
Inter and intra cluster statistics can be used to determine the optimal number of clusters, i.e. the most effective number of groups of minimal internal distances and maximal distance to each other. Clustering is used to reduce large numbers of series and thus facilitate feasible time-consuming operations, such as calculations of huge correlation matrices, etc. Clustering can be used to reveal similar behaviours, e.g. price negotiations between competitors, etc.
Calculation of Non-normal Distributions
In most cases, the time series distribution for market factors is assumed to be normal. This does not correspond to the reality, though. Time series often expose skewed and flat tail distributions, which is connected to under-estimation of market risk for improbable large loses (flat tail losses).
For time series with non-normal distribution, it is important to identify the distribution type and its parameters. Numerical estimation of the distance between the empirical distribution and all other standard distribution types (for ex. Beta, Cauchy, Student, Weibull, etc.) allows users to choose the best fitting distribution type. This is important for the Copula Monte Carlo VaR simulation, which uses correlated non-normal distribution samples, instead of correlated normal distribution samples.
Multifactor Modelling
Its aim is to build a polynomial formula, which describes an unknown market instrument using instruments with known pricing models, based on time series' best fit. After the formula has been created, it is periodically calibrated, using target instrument and explanatory instrument time series. After a target factor has been selected, explanatory factors must be chosen, either through automatic suggestion and/or manually. Explanatory factors are obtained from a cluster in which the target factor is classified. The generated formula can be used to develop a new type of instrument, that will have a pricing approach based on a set of known factors.
Assessment of Implied Ratings
Basel III requires rating scales to be based on explicit CDS (Credit Default Swap) time series (CDS spread curves or indices, bond prices, share prices, etc.). Available time series are used to build and constitute a given number of rating degrees and to determine their boundaries, as well as to forecast the next probable rating that will correspond to a new series. Implied ratings and rating tendencies of an asset are determined based on its CDS Curve or CDS-Index (CDX) by attaching greater significance to the last value and using the weighting of series values (EWMA by Decay Factor).
Time Series Prediction
By analysing a given time series, the behaviour for a given time horizon can be predicted, using the neural network. In addition, confidence bounds with predicted values and prediction quality statistics can be obtained. The learning effect is obtained by a sliding window, for example the period of 20 days, which is shifted along the historcal time axis. The historical value within this window is used as a learning sequence and the values in the window correct and enhance the learned behaviour. A prediction occurs once the window reaches the end of the time series.
Liquidity Management
The modules for liquidity management offer effective technologies and procedures for monitoring, measuring and controlling of liquidity positions:
- Definition of multi level balance sheets.
- Aggregation of cash flows using expressions.
- Definition of liquidity plans containing periodic cash flows and balance developments along the time axis, which are aggregated hierarchically to balance sheet items.
- Reporting of liquidity plans.
- Simulation and assessment of market variables CfaR and EaR.
- Reporting of CfaR and EaR.
Cashflow-at-Risk (Presentation in English)
Cashflow-at-Risk (Presentation in German)
Liquidity Management and Cash flow/Earning at Risk
Liquidity Management and Cash flow/Earning at Risk (in German)
Management of Liquidity Risks using Liquidity Manager
Liquiditätsrisikomanagement (German)
IFRS Accounting Management
The application of IAS 32, 39 Subledger Accounting written in C# enables the transfer of existing accounting records from IAS 32, 39 Balance Accounting – or the entry of manually created accounting records – into the accounting journal. It makes it possible to post these records on freely defined, IAS compliant, accounting structures. The functionality of the application includes the following properties:
1. Functionality of IAS 32, 39 Balance Accounting:
- Definition, generation and export of accounting records
- Definition of standard accounting records (accounting pattern)
- Generation and export of accounting records
2. Functionality of the application of IAS 32, 39 Subledger Accounting
- Import and transfer of accounting records and their classification in the accounting journal. Demonstration of the IAS accounting for the accounting amount.
- Manual entry of new and correction of transferred booking records; definition and usage of standard booking records (accounting pattern)
- Freely defined accounting frameworks: multiple accounting frameworks can be defined (IAS, Bank, etc.)Freely defined accounting frameworks: multiple accounting frameworks can be defined (IAS, Bank, etc.)
- etc.
Subledger Accounting
Nebenbuch Kurzbeschreibung (German)
IAS Accounting Manager
IFRS Accounting Manager (German)
Sustainability Expert System for ESG
The Sustainability Expert System (SES) is a complex software system for automated or hybrid Environmental, Social and Governance (ESG) scores calculation and ESG rating generation. The SES is applicable to every entity within the global economic landscape, with a focus on SMEs.
To the unique set of features integrated into SES belong:
- artificial intelligence (AI) tools for rule-based reasoning;
- neural networks;
- multi-factor modelling;
- Monte Carlo simulation;
- advanced IT solutions for parallel processing.
From a technical point of view, SES is a server-based solution built around an AI executive kernel, that interprets various rule-based models incorporating the business logic and functionality embedded into a set of modules. In terms of functionality and subordination, the latter are grouped in five subsystems as illustrated by the diagram:
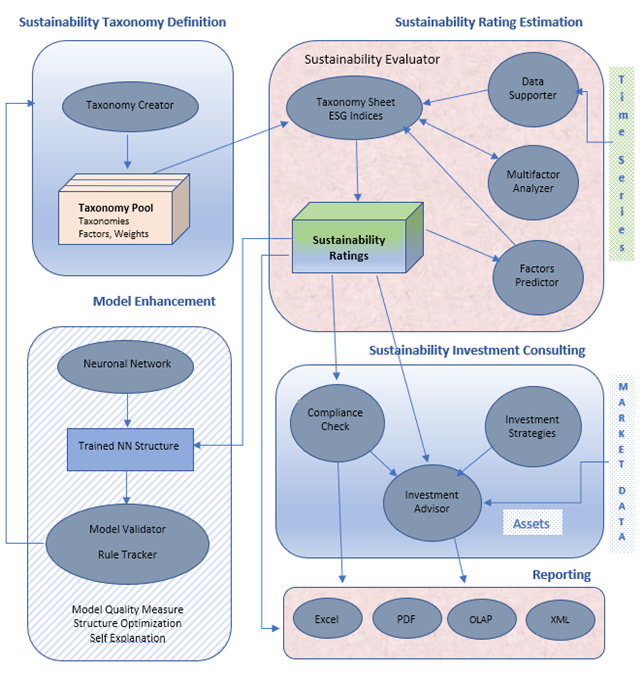
Within the Sustainability Rating Estimation subsystem, the ESG scorings are generated. Here, the Sustainability Evaluator generates the specific rating of the entity under assessment by using:
- automatically aggregated historical series of ESG indices (data published by rating agencies, managed by the Data Supporter module and subjected to a multi-factor analysis through the Multifactor Analyser);
- taxonomy data coming from the Sustainability Taxonomy Definition subsystem (again, analysed by degree of factor correlation and weighted accordingly).
Sustainability Expert System
Inea Consulting Ltd. used the Sustainability Expert System (SES) of Eurorisk Systems Ltd. to create ESG Rating for the French Energy Company EDF SA